
One of the many reasons I love Cloud Native and Open Source is the wealth of options we have at our disposal. In this blog post, I’ll introduce some of the tools I currently use on my laptop.
I was inspired to make this blog after reflecting on how quickly I was able to begin developing my ideas in the previous few weeks. All these tools are free, quick to start with, and have good communities behind them. You could get some tips for your use case.
First, let us understand what I do at work – I am in a platform team using Kubernetes and Self Service concepts. This means I need to develop for Kubernetes and that I need to integrate a bunch of different services with each other; an example is Ansible AWX and Azure DevOps Pipelines.
Minikube
To efficiently develop and test stuff for Kubernetes, I like using Minikube. Minikube is a lightweight single-node Kubernetes cluster installed directly on your laptop. It makes it super easy to start testing things without relying on dedicated servers or cloud offerings.
Since Kubernetes workloads are very portable, the workloads running on my laptop could be moved to another Kubernetes Cluster without much hassle.
And Minikube is not intended to be used as anything close to a Production workload. It’s for local development and testing only,
In fact, my current test-instances of Uptime Kuma, PostgreSQL, and many more are running on Minikube.

To get started with Minikube, take a look here: https://minikube.sigs.k8s.io/docs/
Warp
I have not used Warp too long, but my current impressions are good. Warp is a terminal prompt made in Rust, integrating “Smart” features such as integrated AI, an AI prompt as a sidebar, and more.
The main feature in warp for me is Warp Drive.
Warp Drive allows you to store “Workflows”, these are parameterized command, which really helps reusing and sharing commands.
Here, you can see i have created a Workflow called “patch service to use type nodePort”
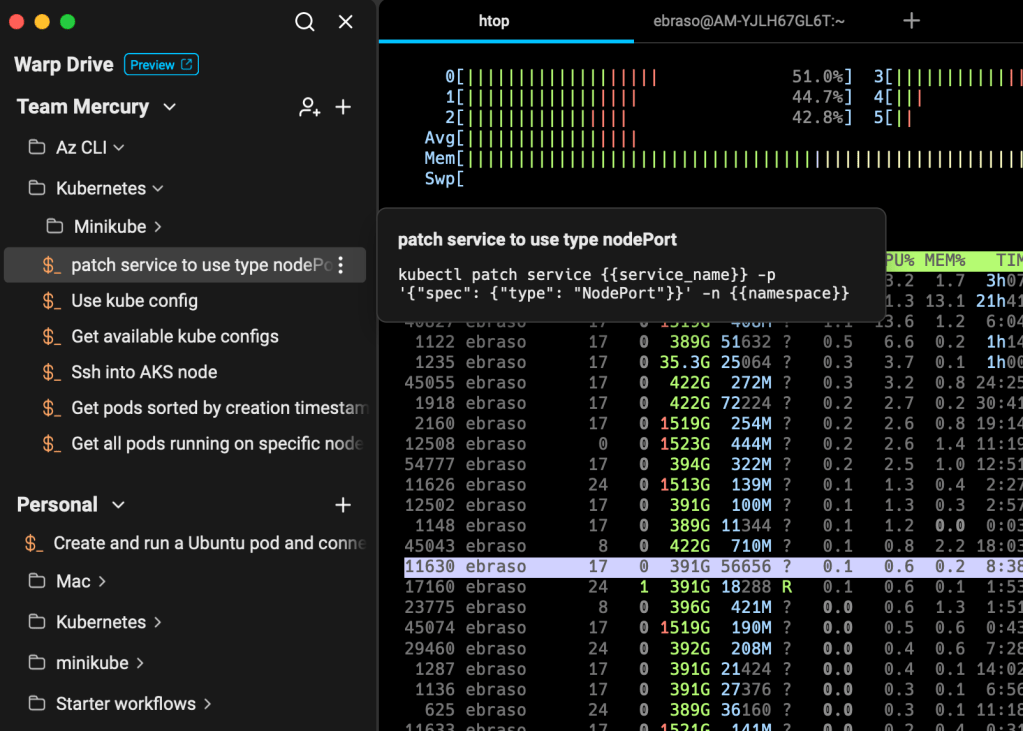
If i select this workflow, the command is pasted into the terminal, and a description is provided:

Oh, it also has AI integrated, so that should help write more effectively!
But, an issue i have with Warp is that full Kubectl autocompletion is not supported. This prevents me (and i think a lot others), from using warp for all tasks involving Kubernetes.
Read more about Warp here:
Postman
Postman has made my life way easier..
Postman has a structure which really helps out organising APIs you may be working with.
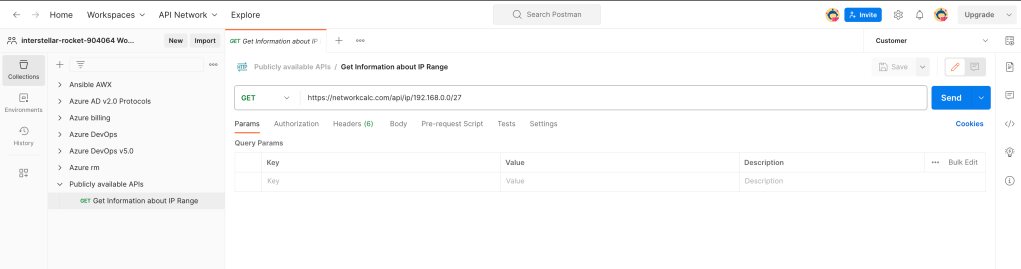
In Postman you can have one or more Collections, with one or more folders, which itself may contain one or more Requests. (you get the idea)
For example, i have Collections for AWX, for Azure DevOps, etc.
Postman also has the concept of Environments, which helps out with isolating and using multiple sets of variables.
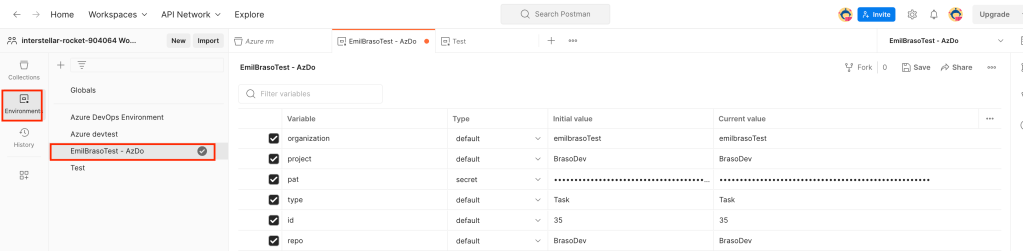
Here, i have a specific environment for my personal Azure DevOps instance, and the variables here are specific to this one.
The requests themselves are parameterised, allowing me to just swap environments when i need to test with another set of values.

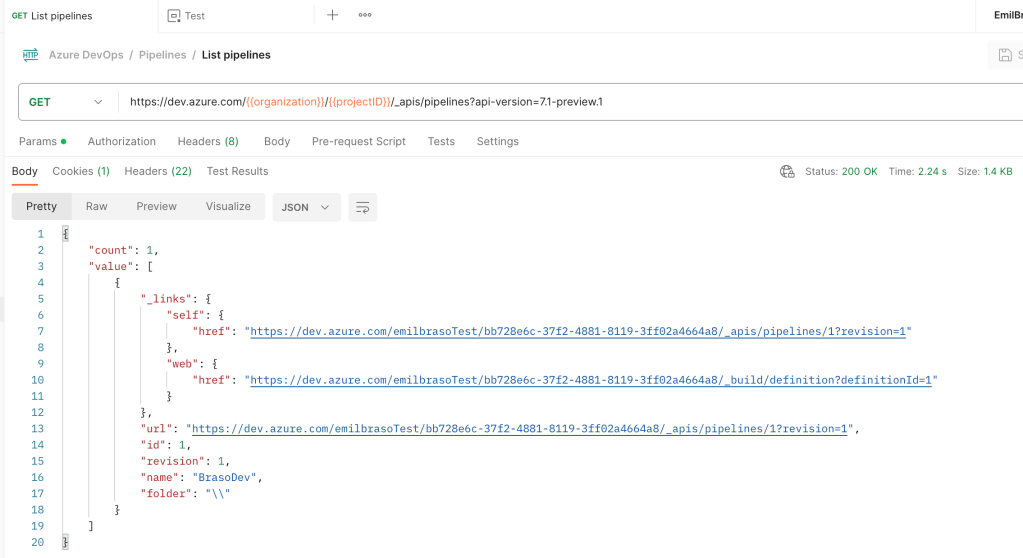
A request can be run, using Send:
Read more about Postman here:
PostgreSQL
PostgreSQL is probably the most popular Open Source Database out there. It has a great community behind it, and have been developed for more than 35 years. (thats 10 years older than me!!)
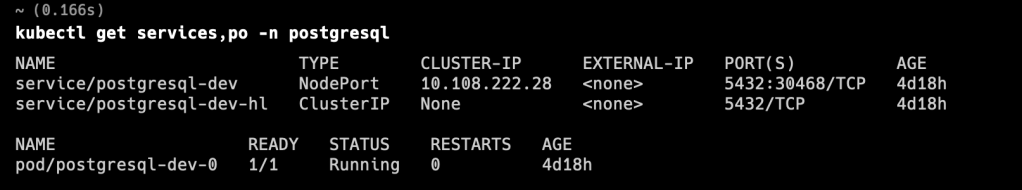
I am actually currently running a PostgreSQL server on Minikube, as I am designing a database for use somewhere else. Using Helm, this was pretty seamless.

Currently, the service for PostgreSQL is of the type NodePort, so its reachable from tools on my laptop.
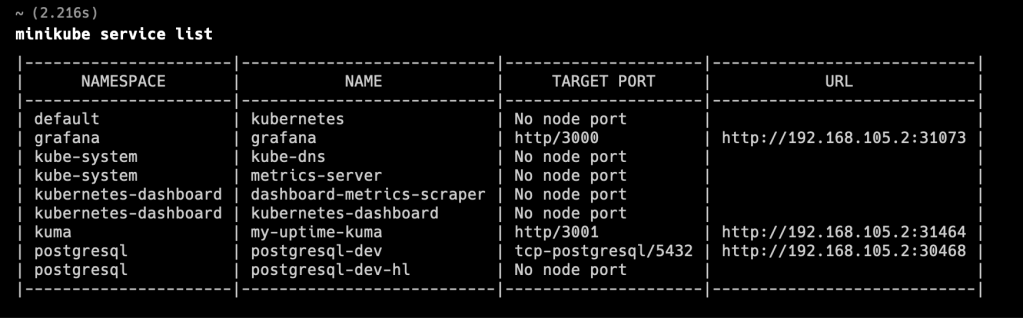
Using Minikube services list, I can see URLs for all NodePort services on my minikube:
Read more about PostgreSQL here: https://www.postgresql.org/
And here is the HELM chart i had used: https://artifacthub.io/packages/helm/bitnami/postgresql
Uptime Kuma

To be honest, im really a fan! Uptime Kuma is by far the Monitoring tool that i have had the best time getting started with.
I installed it with helm, and using the minikube services command, i was quickly able to open the page and get started creating monitors. Here is the dashboard showing my current two monitors:

The add monitor wizard looks like this:
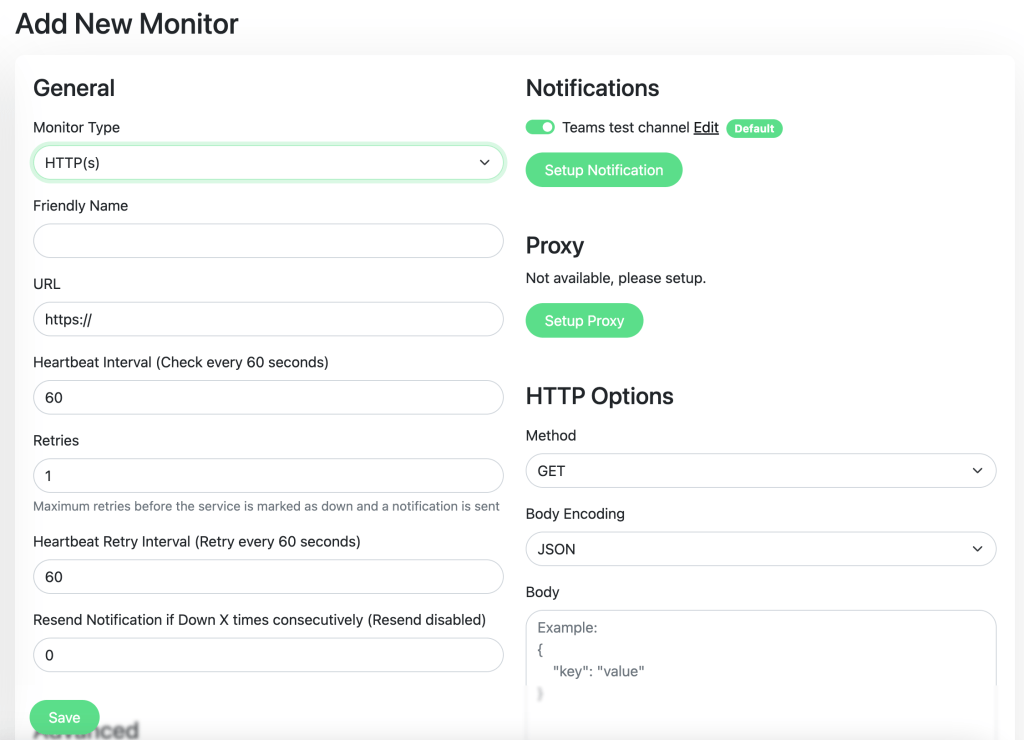
I can select from a bunch of different types (PostgreSQL is one of them, for example), and I can set up notifications from here. Pretty easy to use.
In addition, Uptime Kuma has Status pages which can be configured to show a specific set of uptime monitors.
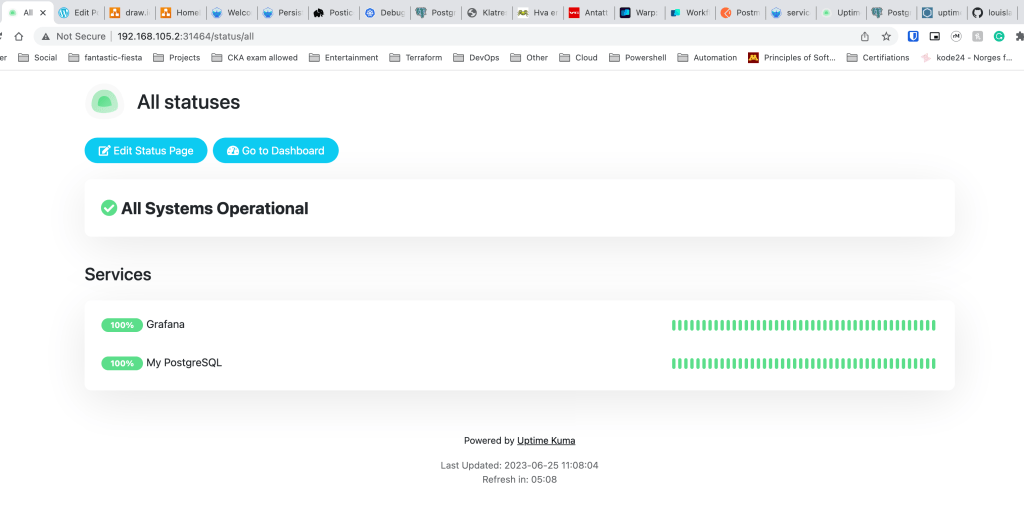
This example shows all statuses. Another example would be to create a specific status page tailored to one audience. Maybe you have a team that only cares about the status of Azure services? that’s a status page.
You can also create incidents or schedule maintenance directly from here, should you need to tell users that something is going on.
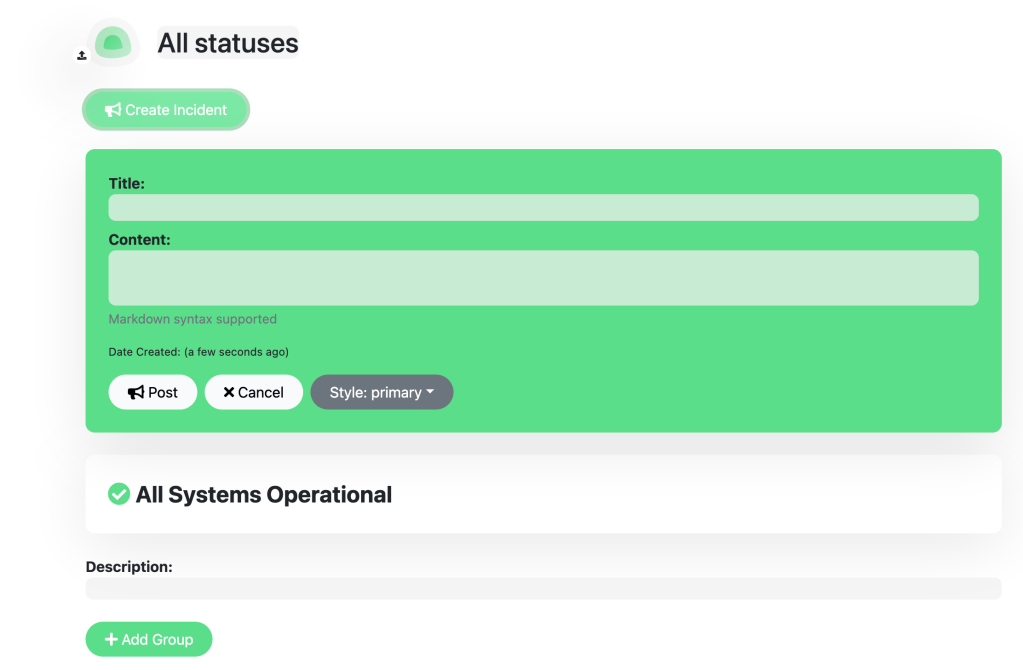
Honestly, this is a godsend. If the users of your product/platform/whatever gets used to using this status page, you can avoid a lot of direct questions or conversations. In terms of scalability, this is great.
Lear more here: https://github.com/louislam/uptime-kuma
Here is the chart i used: https://artifacthub.io/packages/helm/uptime-kuma/uptime-kuma
Conclusion
Thanks for making it this far, i hope you got something out of this post.
This really just scratches the surface(es) of these great tools, but dont hesitate to let me know if you want to know more about any of these.

Leave a comment